
Analytics data is great for seeing where your traffic comes from, and where it goes, but it has a blindspot in determining what a user specifically does on page. Click heat mapping logs the coordinates of where users click and visualizes them. As more users click an area, it becomes "warmer," with red indicating the areas of highest interest. For example, the heat map below tells us at a glance that our visitors are most interested in our portfolio.
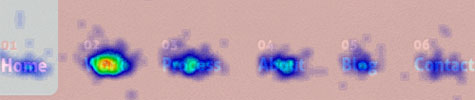
(Heat map of the ethercycle.com navigation depicting clicks of 1,764 users during a 7-day period.)
While traditional analytics data can often feel like abstract statistics, heat maps are an easy way to understand user behavior. More importantly, they can diagnose confusing design elements by showing if users are clicking something they shouldn't.
We recommend Labs Media's ClickHeat. It is open source software, released under general public license, and free of charge.